Buckle Up, Your Data Journey Is Just Getting Started!

Your data is an asset
It’s difficult to go online these days and not be inundated with uses of the word “data.” Common variations include big data, data security, data privacy, data analytics, data science, data camp, data fraud, database and many, many more. Then there are the statistics about the ever-increasing quantities and uses of data, such as that 90% of all data was created in just the last two years.
All of this can feel a bit data-whelming, and unfortunately, many tech companies tend to exacerbate the problem by piling an endless stream of jargon into the mix (clouds, lakes, AI/ML, RESTful, etc.).
At Brightly, we aim to cut through the noise and help you focus on two things:
- Your data is an asset
- Using your data effectively is a journey that leads to better decision-making
Both of the above are cyclical in nature, meaning they feed off each other. The more you treat your data like an asset, the data-driven more strategic and tactical decisions you make, the more your data asset appreciates and so on.
Like all journeys, you have to start somewhere, and it’s important to have a goal in mind that you’re working toward. To better illustrate how this works, we use a concept called the data hierarchy of needs.
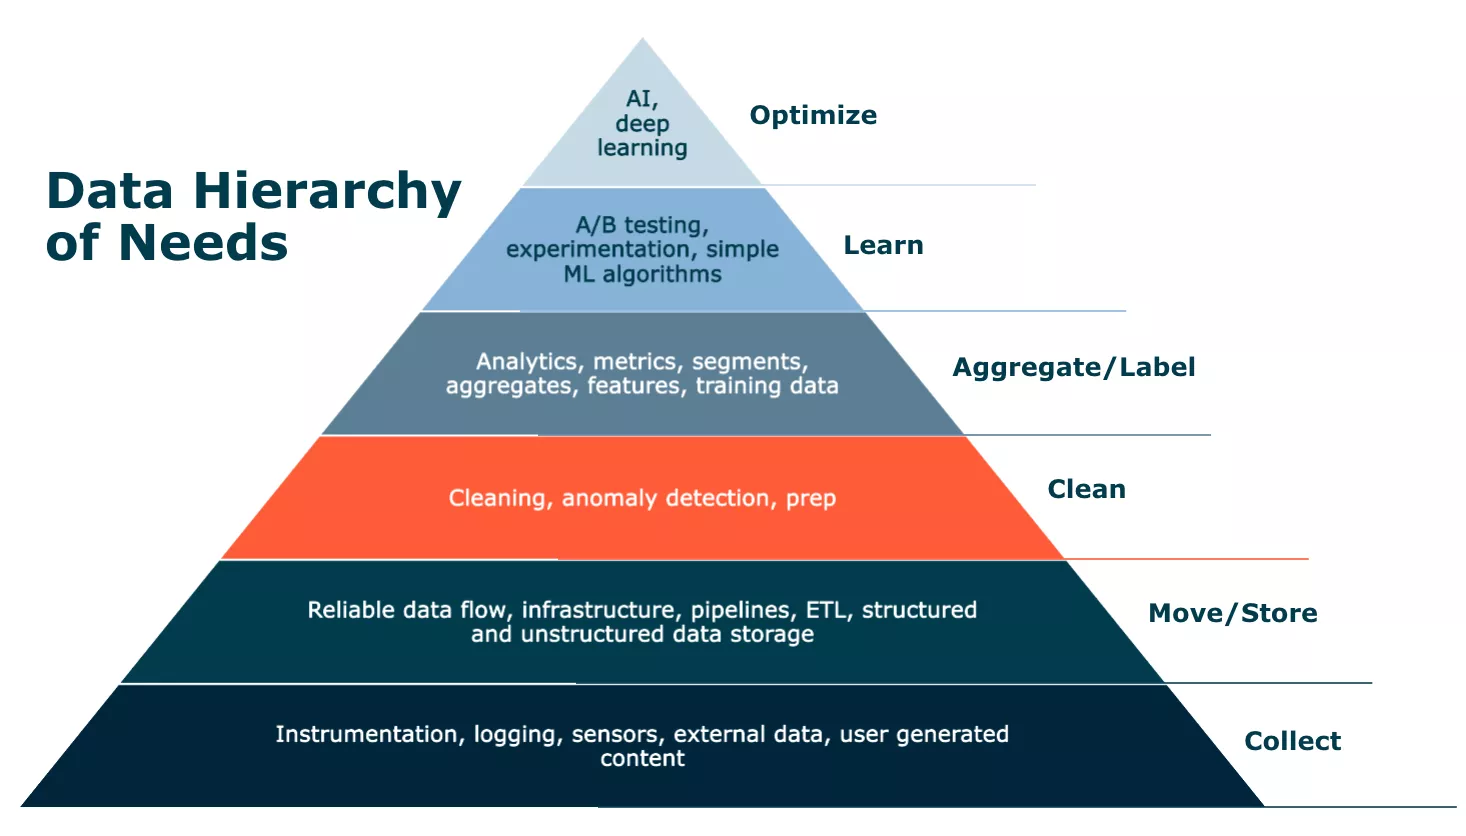
A similar and familiar concept is that of Maslow’s hierarchy of needs. Maslow's hierarchy of needs was used to study how humans are motivated. One of the main takeaways of Maslow’s findings was that a lower level must be completely satisfied and fulfilled before moving on to a higher pursuit.
The same thing is true in the data hierarchy of needs. It shows that if you want to get the most value out of your data through methods such as machine learning and prescriptive analytics, you first need to focus on the fundamental enabling steps at the bottom.
From a journey perspective, it’s important not to get bogged down in the jargon and instead remember that good software should do the heavy lifting of collecting, moving, cleaning, etc. for you.
Spreadsheets v SaaS
At this point in the journey, it’s worth addressing one frequently cited objection we hear when we talk about software-as-a-service (SaaS) applications doing this heavy lifting, which is “I can do all of this in Excel.”
First, let’s give Excel and other spreadsheet tools their due. Spreadsheets were among the first killer apps to reach personal computers more than 40 years ago, and inventory management tools such as Excel and Google Sheets are still used by around 1 billion people today. In the tech world, staying relevant for more than four decades is really impressive longevity.
So, while spreadsheets are awesome, if you make them the centerpiece of your data journey, you’re going to have a difficult time progressing up the hierarchy. This is because spreadsheets have serious limitations, such as:
- How much data they can hold
- Susceptibility to human error
- Security shortcomings
- Lack of workflow and collaboration tools
Moving beyond those limitations is where SaaS platforms have a major advantage
The initial justification for SaaS over spreadsheets often starts with addressing basic business needs and questions. “I just need to get my data organized and produce these reports” is a common refrain.
Progressing up the data hierarchy
That is a perfectly acceptable way to take your data journey a step further. But remember, good software should always be helping you make progress up the hierarchy.
This progress is often demonstrated by being able to move past simple questions and on to more complicated ones because that evolution increases the value you recognize from your data assets – same data, better decisions.
Let’s consider an electricity data example to show how this progression works in the form of questions we can answer as we move up the hierarchy:
- Step 1: How much am I spending on electricity?
- Step 2: Which building uses electricity the least efficiently?
- Step 3: How does weather impact my electricity costs?
- Step 4: How much am I predicted to spend on electricity next week?
- Step 5: What operations and maintenance changes should I make to optimize my budget forecast?
In the first step, we’re just considering basic usage and cost data that has been collected, stored and cleaned for analysis and reporting. With each progressive step, we’re answering more complex questions by adding data sets (smart meters, weather, maintenance, asset sand schedules) and more sophisticated analytics tools such as anomaly detection, deep learning, and prescriptive analytics.
This example can easily be extended to numerous types of data sets and related tactical and strategic questions. You can see the technical jargon and tools being used aren’t what matters.
The important part is the software makes it easy for users to collaboratively increase the value from their data. That’s what the data journey is all about, and that is what the Brightly team gets excited to help our clients achieve.
Contact us to hear more about how our software can take you to the next step on your data journey!

Navigate healthcare’s top trends in 2023
Download your free healthcare trends guide today!
Want to stay up to date with CMMS resources?
Sign up now to receive our monthly resource round-up email to learn about the latest in CMMS, asset management software, industry news, trends and more...


